Data Visualization
Description
Moving beyond the limits of GIS, the team at Eclipse Geomatics has embraced data visualization with Tableau. Tableau enables us to build out the data story using new methods and techniques that go beyond static reports and maps and allow for user interaction and data exploration. Applying the Data Visualization with Tableau Specialization offered through UC Davis, our team at Eclipse Geomatics creates informative and powerful visualizations for our clients, integrating visual elements like charts, graphs, and maps, and wrangling the data into meaningful and interactive visualizations that go beyond the capabilities of a GIS.
Project examples:
Recent visualizations include the results of Wild Salmon Policy Indicator Analysis for the Kispiox TSA as well as Reine’s IronViz 2020 entry Impacts of Wildfires on Air Quality Health in Prince George, BC Canada.
Projects
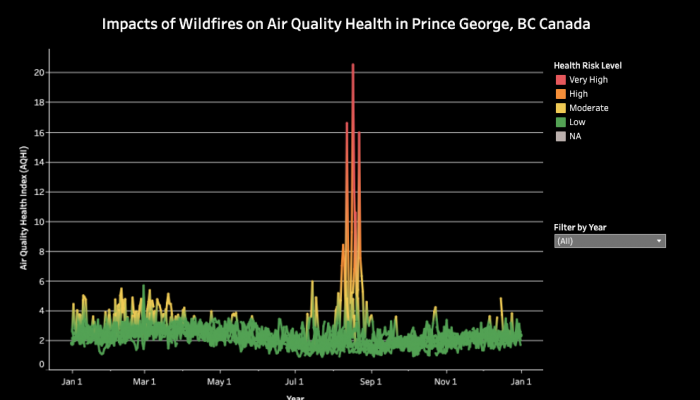
Tableau Data Visualization
Eclipse Geomatics creates interactive dashboards and reports to analyze data using Tableau. Recent visualizations include the results of Wild Salmon Policy Indicator Analysis for the Kispiox TSA as we...
Learn More